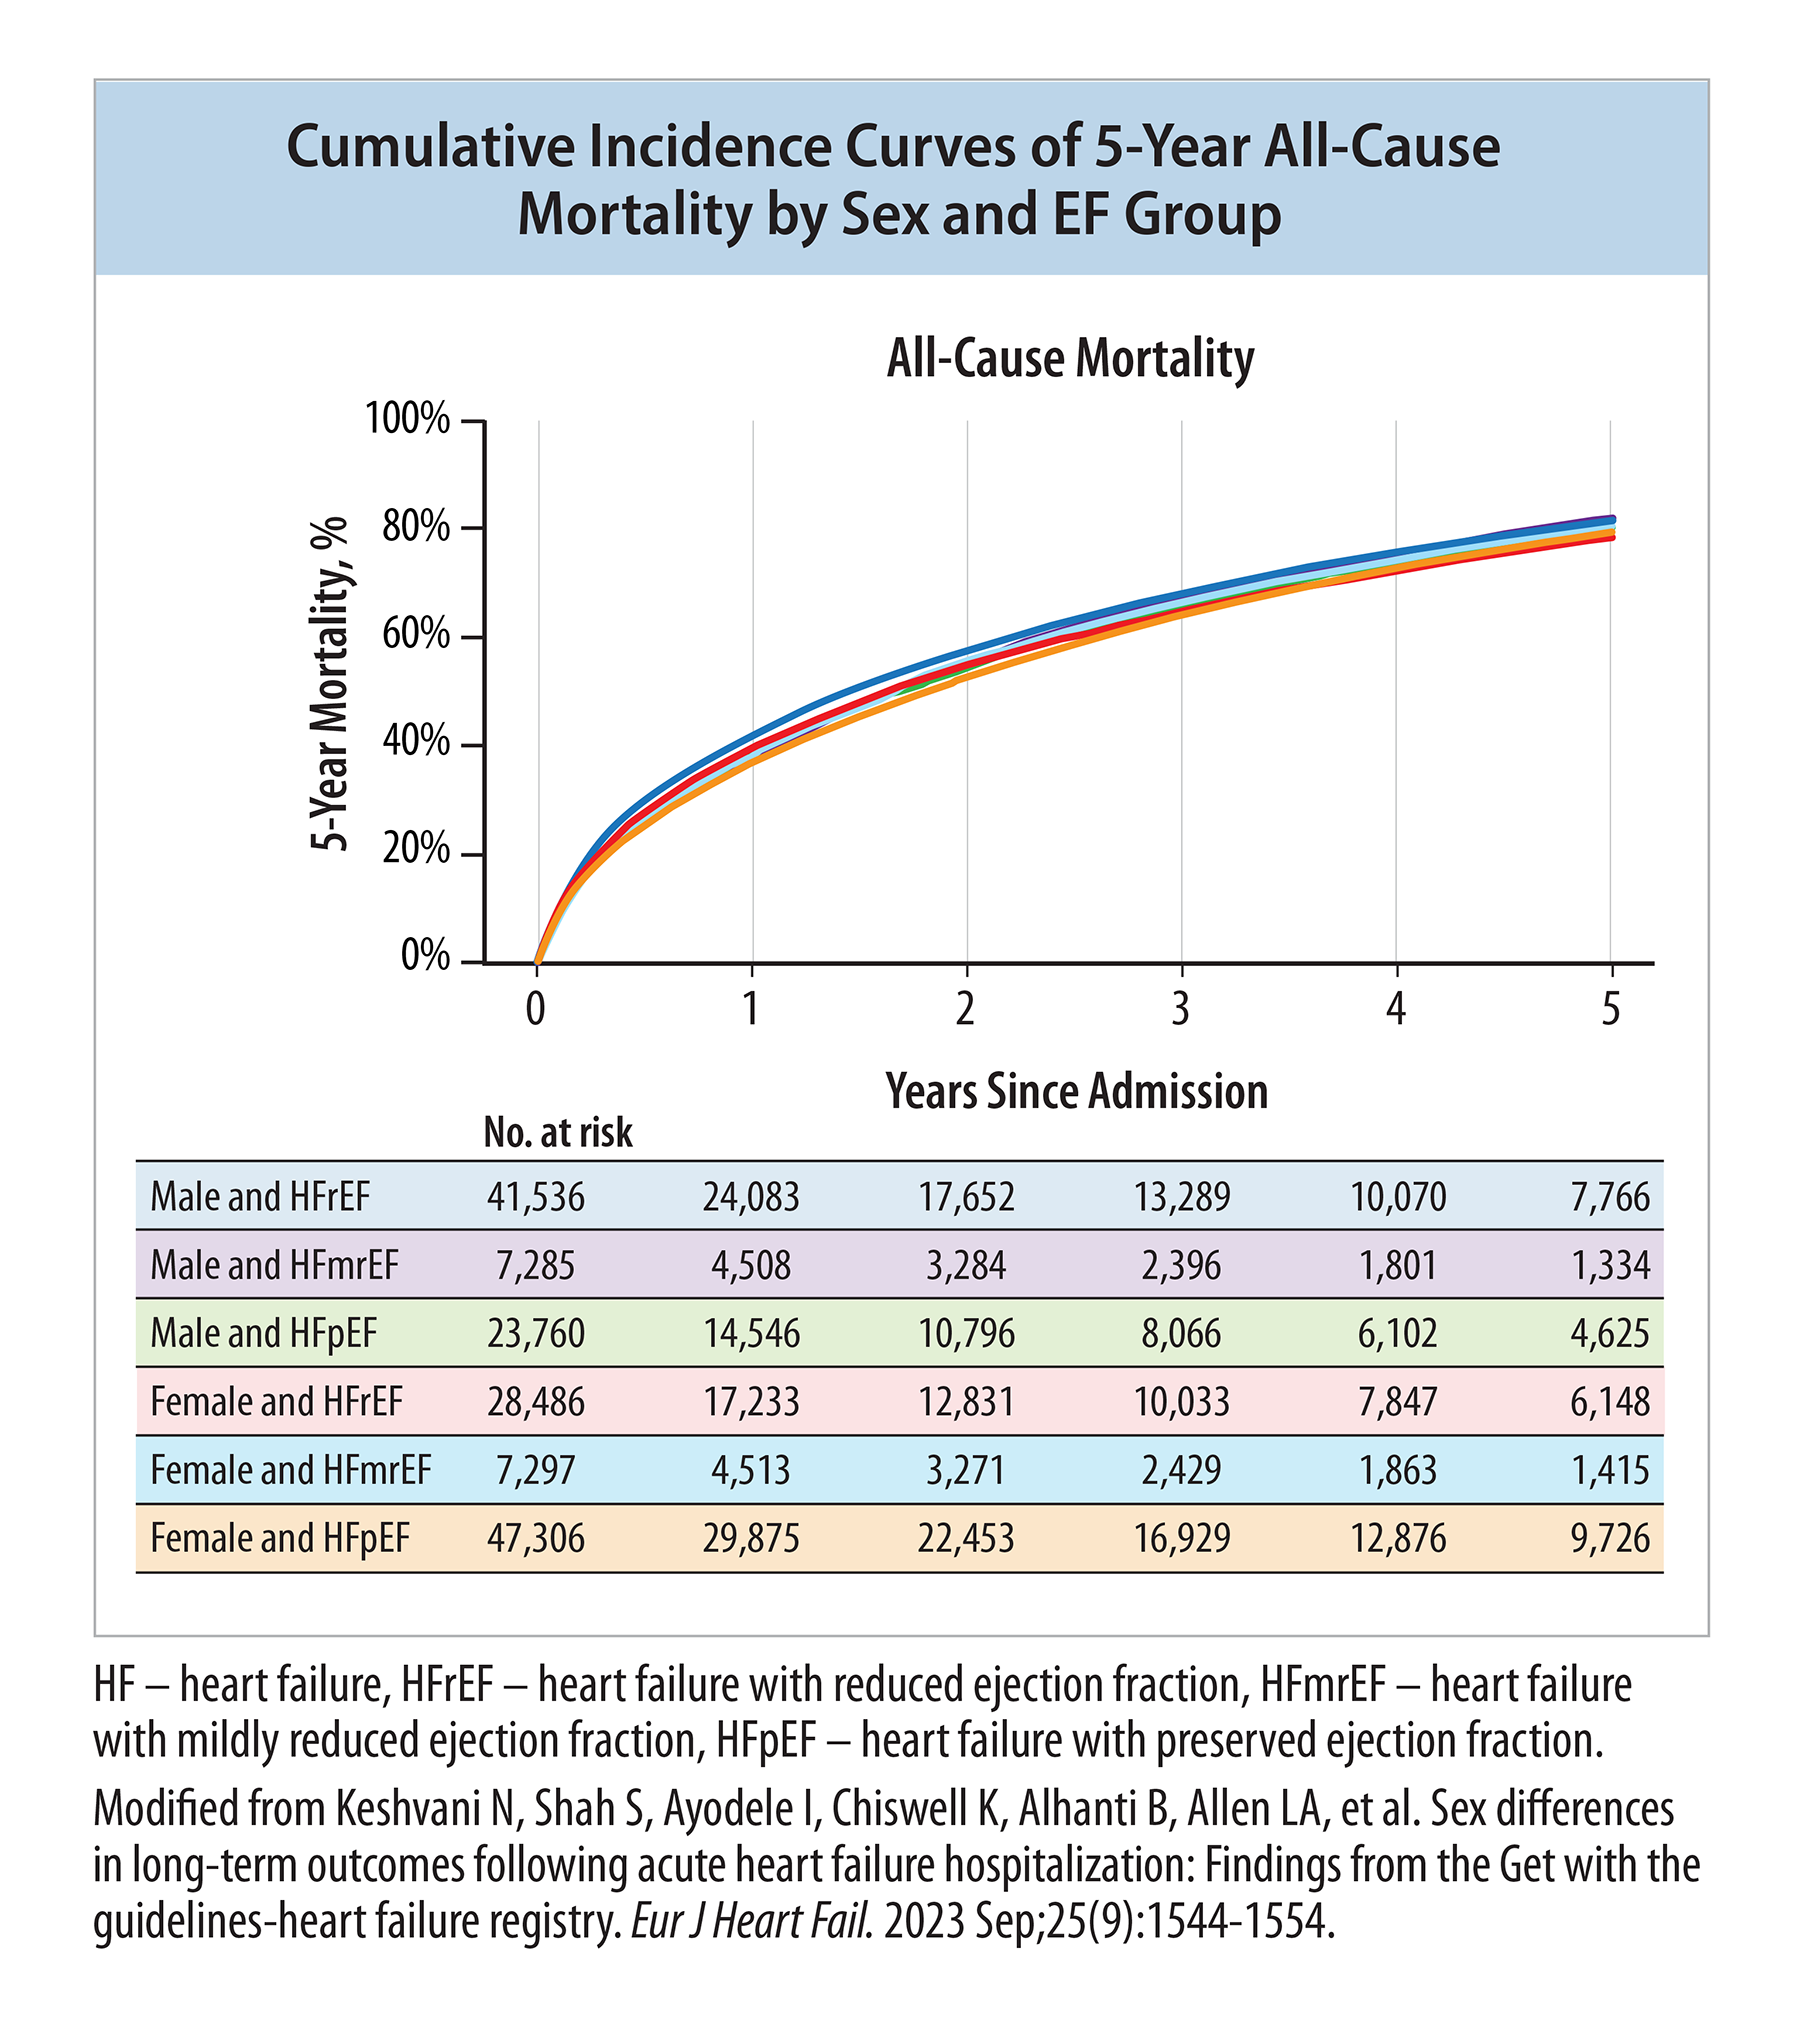
Cumulative Incidence Curves of 5-Year All-Cause Mortality by Sex and EF Group
5-Year All-Cause Mortality, incidence curves, mortality rates, death rates, mortality by sex and EF group, males and females, sex differences, mortality and years since hospitalization, mortality post-hospitalization, long term outcomes, acute heart failure hospitalization, epidemiology, HF subtype, EF group, EF phenotypes, reduced ejection fraction, HFrEF, mildly reduced ejection fraction, HFmrEF, preserved ejection fraction, HFpEF, Get with the Guidelines, GWTG-HF registry