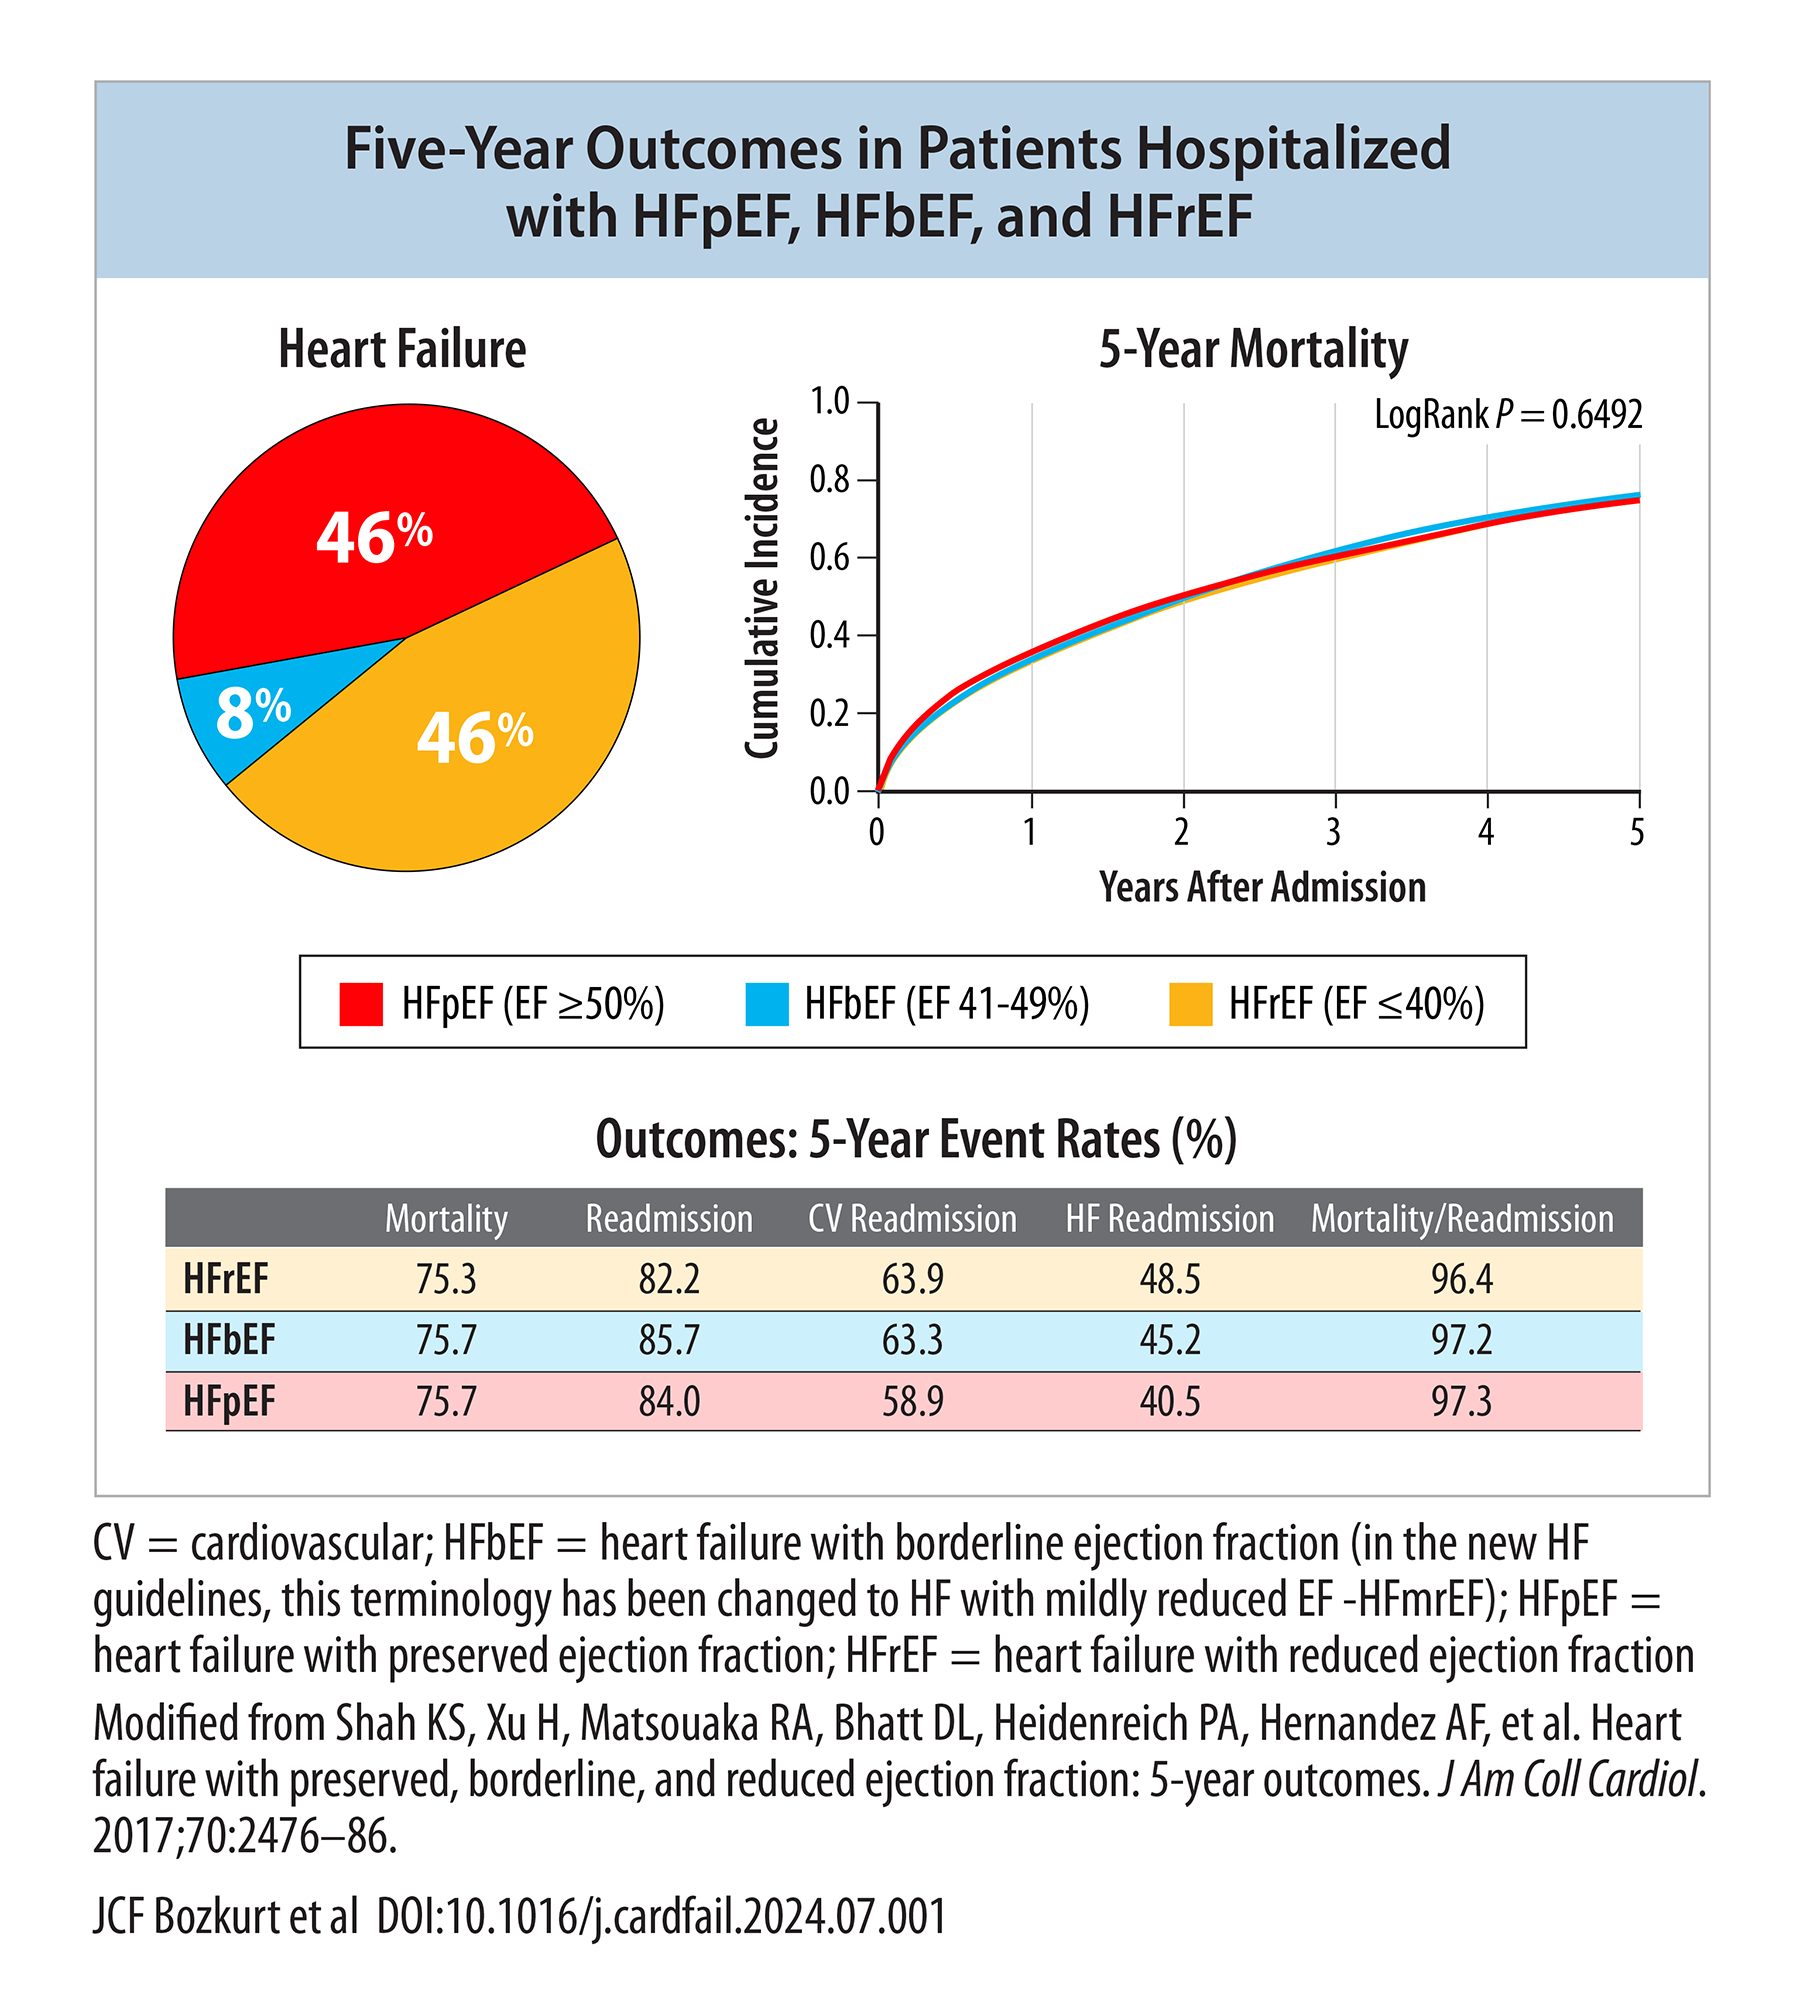
Five-Year Outcomes in Patients Hospitalized with HFpEF, HFbEF, and HFrEF
5-Year Outcomes, five-year outcomes, 5-year mortality, five-year mortality, death rates, mortality rates, incidence curves, outcomes by EF group, post-hospitalization, long term outcomes, epidemiology, HF subtype, EF group, EF phenotypes, reduced ejection fraction, HFrEF, mildly reduced ejection fraction, HFmrEF, preserved ejection fraction, HFpEF, readmissions